Skip to content

For journalists

Figures you can quote.

Two kinds of figures for Saudi Arabia and Oman. Official records, checked against their sources and drawn as you choose them. And Omnia’s own, from the developments we list and the research our desk publishes. Quote any of it with a credit and a link.

Ask the desk

What you can ask us for.

This page is what we publish. Behind it is a team with more than twenty years in prime residential property, and more data than fits on a page. Ask for what your story needs.

  1. A data cut

    A series cut the way your story needs it: one city, one property type, a longer period, or asking prices from our own inventory.

    Make a request: A data cut
  2. Comment or an interview

    A named director on the record, on Saudi Arabia, Oman, the wider Gulf or buying property across borders.

    Make a request: Comment or an interview
  3. A market briefing

    Background before you write: how a market works, what has changed, and where the figures come from. On the record or off it.

    Make a request: A market briefing
  4. The research behind a report

    The method and the full tables behind any report we publish, so you can check a figure before you print it.

    Make a request: The research behind a report

Chart explorer

Choose a market, then a series.

Every official series we hold, drawn as you choose it. Each line comes with its latest figure, a citation to copy and a chart to embed.

Market
Read it

GASTAT’s Real Estate Price Index, 2023 = 100, built from the Ministry of Justice’s registered sales. Levels to Q1 2026; GASTAT has printed only the changes since.

Compare up to three
7080901001102023 = 100Q1 21Q3 21Q1 22Q3 22Q1 23Q3 23Q1 24Q3 24Q1 25Q3 25Q1 26

Q1 26

Residential
100.5
Apartments
100.5
Villas
96.9

To quote

Residential

+2.3%

on a year earlier, Q3 2026

Saudi Arabia, Residential: +2.3% in the year to Q3 2026 (GASTAT Real Estate Price Index). Omnia Capital Group, www.omniacapitalgroup.com/en/markets/saudi-arabia/property-prices

Embed this chart
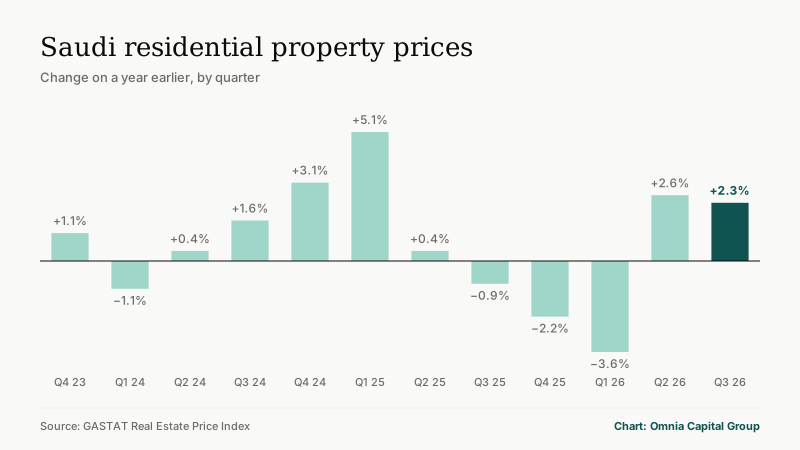
Saudi residential property prices: change on a year earlier, by quarter
<figure>
  <a href="https://www.omniacapitalgroup.com/en/markets/saudi-arabia/property-prices"><img src="https://www.omniacapitalgroup.com/media/charts/saudi-residential-prices.svg" alt="Saudi residential property prices: change on a year earlier, by quarter" width="800" height="450" loading="lazy" style="max-width:100%;height:auto"></a>
  <figcaption>Source: GASTAT Real Estate Price Index. Chart: <a href="https://www.omniacapitalgroup.com/en/markets/saudi-arabia/property-prices">Omnia Capital Group</a>.</figcaption>
</figure>
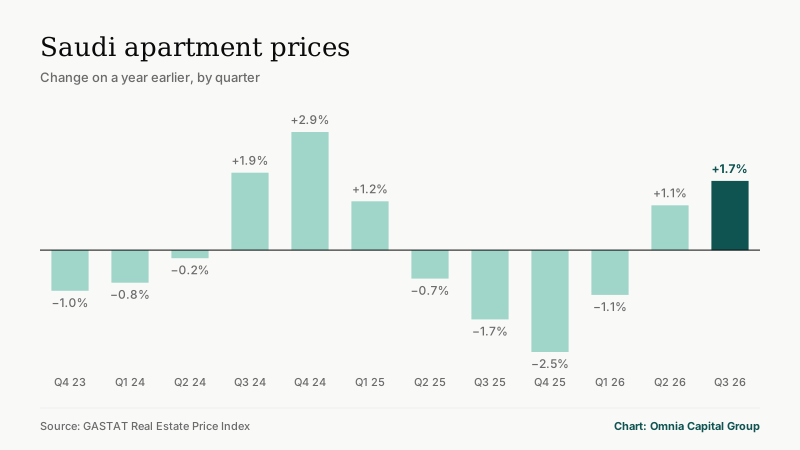
Apartments

+1.7%

on a year earlier, Q3 2026

Saudi Arabia, Apartments: +1.7% in the year to Q3 2026 (GASTAT Real Estate Price Index). Omnia Capital Group, www.omniacapitalgroup.com/en/markets/saudi-arabia/property-prices

Embed this chart
Saudi apartment prices: change on a year earlier, by quarter
<figure>
  <a href="https://www.omniacapitalgroup.com/en/markets/saudi-arabia/property-prices"><img src="https://www.omniacapitalgroup.com/media/charts/saudi-apartments-prices.svg" alt="Saudi apartment prices: change on a year earlier, by quarter" width="800" height="450" loading="lazy" style="max-width:100%;height:auto"></a>
  <figcaption>Source: GASTAT Real Estate Price Index. Chart: <a href="https://www.omniacapitalgroup.com/en/markets/saudi-arabia/property-prices">Omnia Capital Group</a>.</figcaption>
</figure>

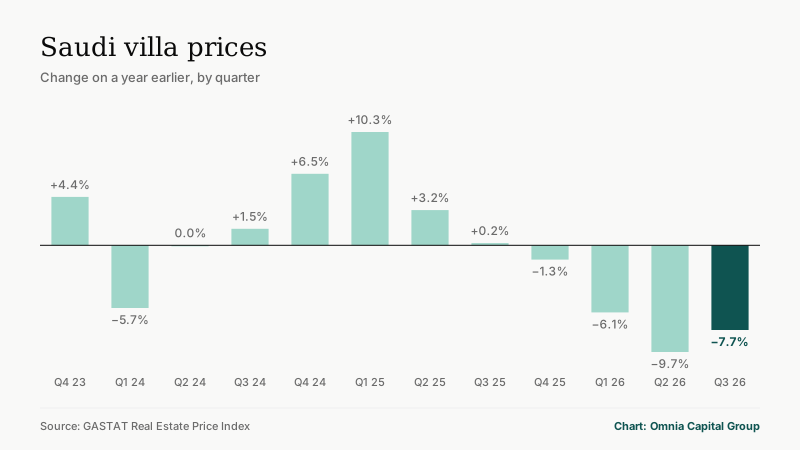
Villas

−7.7%

on a year earlier, Q3 2026

Saudi Arabia, Villas: −7.7% in the year to Q3 2026 (GASTAT Real Estate Price Index). Omnia Capital Group, www.omniacapitalgroup.com/en/markets/saudi-arabia/property-prices

Embed this chart
Saudi villa prices: change on a year earlier, by quarter
<figure>
  <a href="https://www.omniacapitalgroup.com/en/markets/saudi-arabia/property-prices"><img src="https://www.omniacapitalgroup.com/media/charts/saudi-villas-prices.svg" alt="Saudi villa prices: change on a year earlier, by quarter" width="800" height="450" loading="lazy" style="max-width:100%;height:auto"></a>
  <figcaption>Source: GASTAT Real Estate Price Index. Chart: <a href="https://www.omniacapitalgroup.com/en/markets/saudi-arabia/property-prices">Omnia Capital Group</a>.</figcaption>
</figure>

Omnia’s own data

What we see first hand.

The figures above are official records. These are ours. They come from the developments listed on this site and from the research our desk publishes, and each one says what it counts.

From our inventory

What the developments we list are asking.

From-prices: the lowest price each development is offered from, as listed on 10 November 2026. A development or a phase with a page of its own counts once. These are asking prices for the developments we list, not sale prices and not the whole market. A price listed in another currency is converted at the day’s rate.

Saudi Arabia, 10 November 2026
PlaceListedWith a priceLowest from-priceMedian from-price
All of Saudi Arabia4327SAR 266,799SAR 2,138,181
Riyadh2819SAR 579,000SAR 2,000,000
Jeddah127SAR 266,799SAR 2,138,181

By build stage: 24 off-plan, 4 under construction, 5 ready. No stage is given for 10.

Citation

Saudi Arabia: a median from-price of SAR 2,138,181 across 27 developments with a published price, as listed on 10 November 2026. Source: Omnia Capital Group inventory, www.omniacapitalgroup.com/en/developments/in/saudi-arabia

See the listings
Oman, 10 November 2026
PlaceListedWith a priceLowest from-priceMedian from-price
All of Oman2216OMR 33,530OMR 138,530
Muscat2116OMR 33,530OMR 138,530

By build stage: 10 off-plan, 12 under construction, 0 ready.

Citation

Oman: a median from-price of OMR 138,530 across 16 developments with a published price, as listed on 10 November 2026. Source: Omnia Capital Group inventory, www.omniacapitalgroup.com/en/developments/in/oman

See the listings

Official records

Three sets of records, each with its source.

Each one comes from a government body’s own records. We check it, chart it and keep the file current. The citation credits the publisher first, and says where a figure is our own calculation.

Saudi Real Estate Price Index

Prices by sector, property type and region, 2023 = 100.

Published by
General Authority for Statistics (GASTAT)
How often
Quarterly
Latest period
Q3 2026
File updated

Citation

Saudi residential property prices: +2.3% in the year to Q3 2026 (GASTAT). Omnia Capital Group, Saudi property prices, www.omniacapitalgroup.com/en/markets/saudi-arabia/property-prices

Saudi residential sales by city and district

Sales and their total value by quarter, with a median price per square metre that we calculate.

Published by
Ministry of Justice and the Real Estate General Authority (REGA)
How often
Quarterly
Latest period
Q1 2026
File updated

Citation

Saudi residential sale prices by city and district, to Q1 2026. Ministry of Justice and REGA data under the KSA Open Data Licence; medians calculated by Omnia Capital Group, www.omniacapitalgroup.com/en/markets/saudi-arabia/property-prices

Oman Real Estate Price Index

Prices by property type and governorate, 2018 = 100.

Published by
National Centre for Statistics and Information (NCSI)
How often
Quarterly, with monthly sales activity
Latest period
Q2 2026

Citation

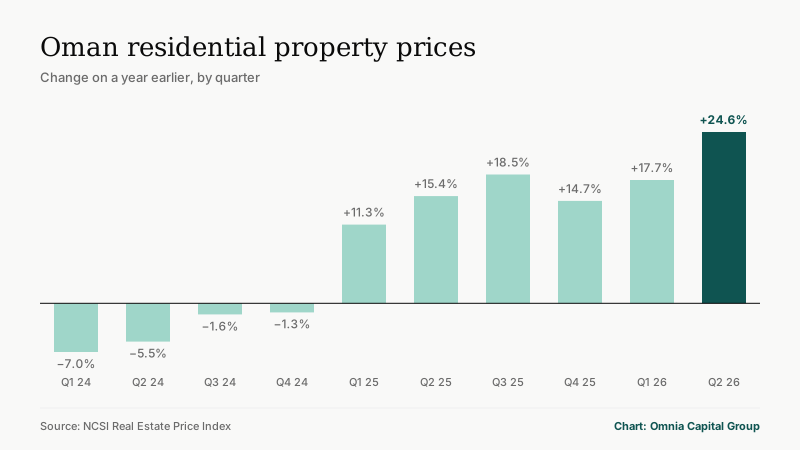
Oman’s residential property price index recorded a year-on-year change of +24.6% in Q2 2026 (NCSI data, charted by Omnia Capital Group, www.omniacapitalgroup.com/en/markets/oman/property-prices).

Charts to embed

Two charts, ready to paste.

Paste the code into a page. The chart is one image that updates itself with each release and carries its source and credit. Every other series has a chart of its own: choose it in the explorer and copy its code there.

Saudi residential property prices: change on a year earlier, by quarter

Embed code

<figure>
  <a href="https://www.omniacapitalgroup.com/en/markets/saudi-arabia/property-prices"><img src="https://www.omniacapitalgroup.com/media/charts/saudi-residential-prices.svg" alt="Saudi residential property prices: change on a year earlier, by quarter" width="800" height="450" loading="lazy" style="max-width:100%;height:auto"></a>
  <figcaption>Source: GASTAT Real Estate Price Index. Chart: <a href="https://www.omniacapitalgroup.com/en/markets/saudi-arabia/property-prices">Omnia Capital Group</a>.</figcaption>
</figure>
Oman residential property prices: change on a year earlier, by quarter

Embed code

<figure>
  <a href="https://www.omniacapitalgroup.com/en/markets/oman/property-prices"><img src="https://www.omniacapitalgroup.com/media/charts/oman-residential-prices.svg" alt="Oman residential property prices: change on a year earlier, by quarter" width="800" height="450" loading="lazy" style="max-width:100%;height:auto"></a>
  <figcaption>Source: NCSI Real Estate Price Index. Chart: <a href="https://www.omniacapitalgroup.com/en/markets/oman/property-prices">Omnia Capital Group</a>.</figcaption>
</figure>

Make a request

Ask the desk.

Tell us what you need and when you file. The request goes straight to the press office.

Step 1 of 2

What do you need, and on which market?

I would like
Which markets

On the record

Or write to us directly

Contact the press office
press@omniacapitalgroup.com